
The process of clearing and grading land for construction projects usually results in highly turbid runoff while construction is underway. Construction projects are required to have an erosion and sediment control plan that uses the best management practices (BMPs) such as sediment basins, check dams, inlet protection and silt fences. These practices have been improved and refined to retain most of the larger particles generated on site. However, the smaller particles still will create high turbidity for construction stormwater. Polyacrylamide (PAM) can reduce the turbidity of the construction stormwater if properly placed in ditches and pipes leading to sediment basins. Discharging cleaner water from construction sites is particularly important in areas draining to sensitive waters, such as the Swift Creek watershed in Raleigh, North Carolina, which is home to an endangered freshwater mussel.
Research Objectives
The objective of this project was to monitor sediment basin water quality — turbidity and total suspended solids (TSS) — with various levels of BMP management and PAM application on an active construction site.
Methodology
Monitoring was conducted between March 2020 and December 2022 during the construction of I-540 in Raleigh. Sediment basins were designed, constructed and maintained by contractors according to North Carolina Department of Transportation specifications. The size of the basins varied depending on the watershed design and potential runoff. Seven sediment basins were monitored during this sampling campaign, where two to three basins were monitored at a time. Basins were monitored for six to 12 months depending on surrounding grading activities.
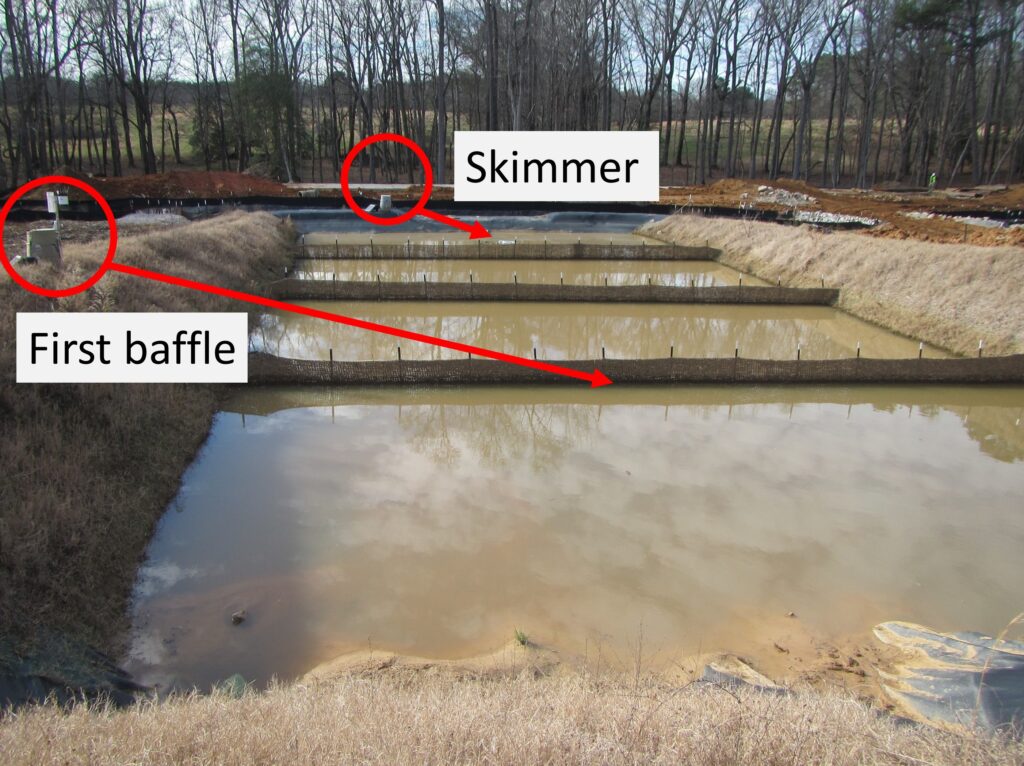
Automatic samplers were installed at each basin to take samples at the first baffle and the skimmer (Figure 1). While sampling at the inlet of the basin would have been preferred, the location was avoided due to previous experience with sampler clogging due to high sediment loads. A sensor connected to a remote monitoring station was placed on the first baffle to monitor water level change in the basin. Samples were taken by the automatic sampler when there was a 0.5 foot increase in the basin water level and every hour after the initial sample as long as the water level was above the 0.5 foot increase. Rainfall data was collected from a tipping bucket rain gauge by the basin. The flocculating agent chosen was PAM 705 (Applied Polymer Systems, Woodstock, GA). A granular form of PAM was applied in 4 oz. increments to each wattle in the ditch leading to the basin. Collected samples were analyzed for turbidity1 and TSS.2 Averages, minimums and maximums for turbidity and TSS were calculated for each rainfall event for each basin and overall, for each basin when the monitoring concluded. Basin 1 represented the “best case scenario” for watershed and BMP management and PAM application on wattles in the ditch leading to the basin, with the remaining having lesser degrees of management.
Findings
Basin 1 had the lowest average turbidity (56 NTU) and TSS (58 mg/L), while Basin 7 had the highest average turbidity (1,822 NTU) and Basin 5 had the highest average TSS (1,550 mg/L) (Table 1). The North Carolina Department of Environmental Quality has set turbidity standards for freshwater streams at 50 NTU and trout streams at 10 NTU.3 The turbidity of Basin 1 averaged just above the limit for freshwater streams. All other basins are well above the 50 NTU recommendation, even for the minimum values, but had discharge turbidities similar to basins in other studies.4 Basins 1, 3 and 7 are detailed below and represent the range of discharge water qualities in the study — the good, the bad and the ugly.
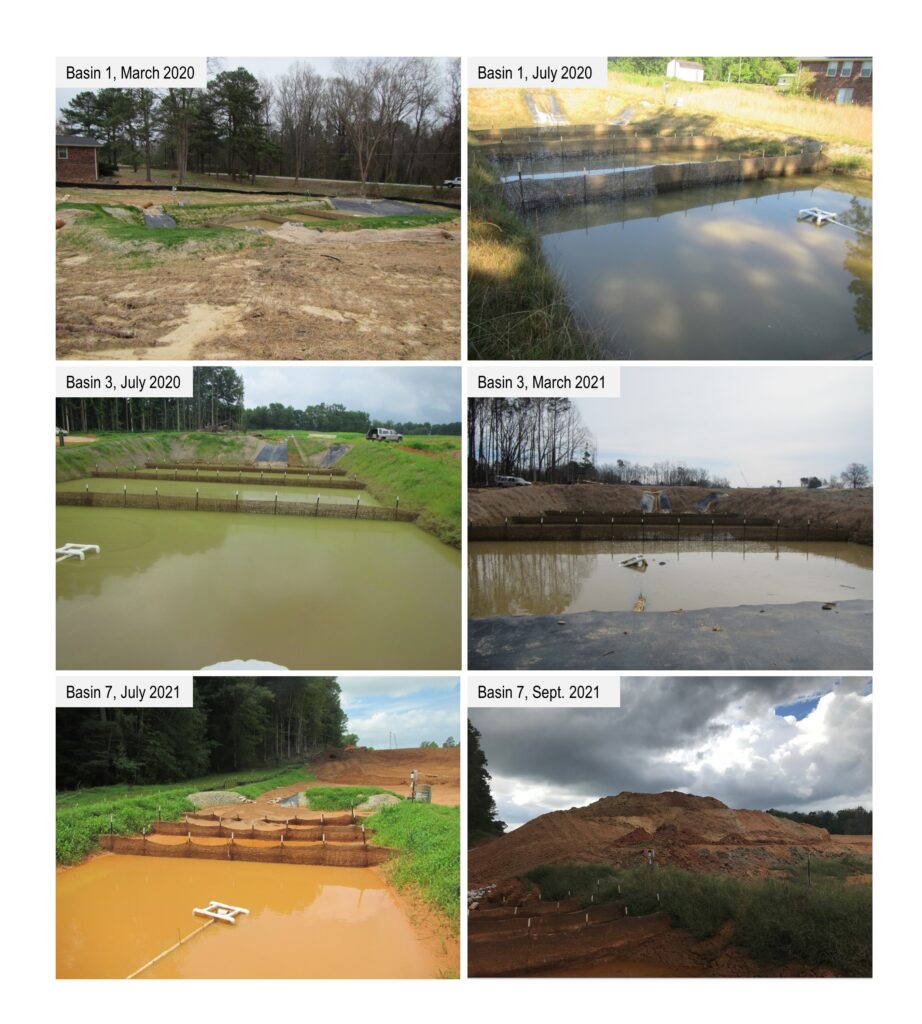
Basin 1 (the good) was the first basin monitored. Much of the area around the basin was covered with grass or erosion control fabric during the monitoring period (Figure 2) and had lower levels of watershed disturbance. Very little earthwork or tree removal was occurring in the basin watershed. The minimal earthwork, good ground cover and consistent PAM application probably led to Basin 1 having the lowest average turbidity and TSS. Basin 2 was concurrently monitored with Basin 1 but did not receive PAM application. Basin 2 was in the adjacent watershed also with good ground cover and little earthwork. PAM application in Basin 1 led to a four times reduction in turbidity and a 2.5 times reduction in TSS compared to Basin 2. However, basin and watershed size were different, so it is hard to directly compare these results.
Basin 3 (the bad) represents the average sediment basin monitored for this project. There was more groundcover at the start of the monitoring compared to the end (Figure 2). Ditches were well maintained in the beginning, but their conditions deteriorated as less emphasis was placed on erosion control practices during the progression of construction and increased amount of earthwork happening in the basin watershed. The increased earthwork in the basin watershed and the increased number of rainfall events could have caused Basin 3 to have higher turbidity and TSS compared to Basin 1 — more earthwork, more rainfall, more erosion potential. As grading activities progressed, more runoff entered the basins without passing through the ditches where PAM treatment could occur. High sediment loads can also overwhelm the PAM treatments.
Substantial earthwork was happening during the monitoring of Basin 7 (the ugly). The area in front of the basin was cleared shortly after monitoring began, and few erosion control practices were implemented (Figure 2). A soil stockpile started to be stored next to the entrance of basin and continued to grow over time with no cover, which lead to extremely high sediment loads entering Basin 7. As mentioned previously, it had the highest average turbidity and second highest average TSS (Table 1). Even though the basin may have been sized correctly for the drainage area, the soil stockpile next to the inlet of Basin 7 clearly overloaded the basin with sediment. The soil stockpile could have been covered periodically to reduce raindrop detachment, or the basin should have been resized to accommodate the higher sediment loads.
There was a trend of turbidity and TSS reduction as the water moved from the first baffle to the skimmer for all basins monitored. Sediment basins reduced the sediment loads in the stormwater within the basin, but not as much as needed in a sensitive waterbody. Because the inflow sample was located at the first baffle to avoid clogged sampling tubing, the reduction in turbidity and TSS is likely underestimated. Previous studies have indicated these basins will capture greater than 90% of the sediment coming into them.
Conclusions
Consistent ground covers and BMP maintenance along with PAM application was found to reduce turbidity and TSS discharged from the sediment basins. There was a clear connection between the amount and type of grading activities and the ability of PAM treatments to be effective. Often the large amount of sediment passing through diversion ditches where there were high disturbance levels and little or no
ground cover overwhelmed the practices. Poor site management has the potential to overwhelm well-designed erosion and sediment control practices. A well-managed site with distributed PAM dosing (as in the case of Basin 1) can produce much better discharge water quality.
Acknowledgements
This research was supported by Adam Howard, Jamie Luther and Christopher Niewoehner. The North Carolina Department of Transportation sponsored the research presented in this article. The findings expressed in this article are those of the authors and do not necessarily reflect the view of the sponsors.
References
- O’Dell, J.W., 1993. Method 180.1: Determination of turbidity by nephelometry. United Stated Environmental Protection Agency, Washington DC. Available at: https://www.epa.gov/sites/production/files/2015-08/documents/method_180-1_1993.pdf.
- U.S. EPA, 2003. Protection water quality from urban runoff. U.S. Environmental Protection Agency. Available from: https://www3.epa.gov/npdes/pubs/nps_urban-facts_final.pdf (retrieved 09 March 2023).
- North Carolina Department of Environmental Quality. Fresh surface water quality standards for class C waters. Available from: http://reports.oah.state.nc.us/ncac/title%2015a%20-%20environmental%20quality/chapter%2002%20-%20environmental%20management/subchapter%20b/15a%20ncac%2002b%20.0211.pdf (retrieved 07 August 2023).
- McLaughlin, R.A. & Jennings, G., 2005. Minimizing water quality impacts of roadway construction. NCDOT Research Project Number 2003-04. North Carolina Department of Transportation.
About the Experts
- Christina Kranz, Ph.D., is a lecturer at North Carolina State University (NCSU). She teaches introductory soil science and facilitates workshops at the Sediment and Erosion Control Research and Education Facility.
- Joshua Heitman, Ph.D., is a professor of soil physics at NCSU. His research focuses on developing techniques to quantify soil physical processes and improve services of soil systems.
- Rich McLaughlin, Ph.D., is emeritus professor at NCSU. He retired after 30 years of education and research to improve water quality, focusing on the impacts of runoff on surface waters.


