


There is a fair amount of uncertainty in our industry regarding proper sampling techniques for construction sites that require turbidity monitoring. This uncertainty comes from a lack of knowledge that can leave those that are required to handle this task confused or unaware of the proper methods.
Due to this lack of understanding, surface water monitoring for turbidity is one of the most overlooked field tools for construction stormwater management. Today, we find most people sample turbidity only for compliance reasons. Our regulatory rules require construction sites not to cause or contribute to a surface water quality violation, and the degree that this violation might occur differs from state to state. It is important to protect water from pollution since less than 3.5% of the water on our planet is fresh or drinkable water to begin with. The remaining 96.5% of the water on our planet is either saline (salty) or polluted.1
Many of us have conducted stormwater inspections and learned how to monitor construction site discharges coming from stormwater runoff and dewatering discharges. Unfortunately, too often we are focused on the construction project deadline and not on the pollution our sites create. Water quality monitoring is often done incorrectly or never done at all and without that we are left not understanding why our Best Management Practices (BMPs) should be installed certain ways, and we do not fully grasp the effects erosion from our site might be having off site.
Water quality, especially turbidity measurement, should be used as an erosion control field tool. It can be a useful tool for us to measure the overall effectiveness of our erosion and sediment control BMPs, including our treatment systems, and not just following a permit condition.
Turbidity is defined as a measure of the amount of light that is scattered and/or absorbed by suspended material in water commonly expressed in nephelometric turbidity units (NTUs).2 Turbidity is measured by electronically detecting and quantifying the scattering of light in water typically using an electronic nephelometer for easy and fast turbidity measuring (Figure 1). The meter used must be approved by a regulatory body, such as the USEPA Regulatory Method 180.1 in the United States or ISO 7027 internationally.
Requirements on nephelometers for other countries will vary based on the country’s particular regulations of water quality standards and methods for measuring turbidity. It is important to always calibrate the nephelometer using the recommended manufacturer’s calibration that is based on standards referenced from the U.S. EPA Regulatory Method 180.1 or internationally, the ISO 7027 before using the nephelometer. These calibrations must use a known turbidity standard 0, 1, and 10 NTU Formazin solutions to calibrate the field nephelometer. These standards will typically come with your nephelometer and these standards will require that the solutions have not expired. The calibration should be performed according to the manufacturer’s specifications, and the readings should be recorded in either a logbook for that nephelometer or on the inspection form.
Turbidity was the adopted water quality standard because it is a much simpler method to collect data than with the much slower method of total suspended solids (TSS), which is done in a laboratory test. This method requires filtering and drying a sample to determine a weight, which can then be converted to a concentration. Turbidity and TSS can be caused by detachment of soil particles from clays or silty soil with TSS being the actual measure of pollution in mg/L and turbidity being the indicator of this in NTU. Your jurisdiction may require TSS but allow you to correlate TSS using turbidity. An increase in turbidity or suspended solids can be an indicator of erosion problems shown to negatively affect aquatic health by:
- Clogging fish gills or the filter-feeding systems of other aquatic animals.
- Hindering visibility, making it difficult for predators to find prey.
- Decreasing light penetration into water and thereby the ability of submerged aquatic plants to photosynthesize, reducing biomass and growth rates of aquatic plants.
- Reducing fish resistance to disease.
- Altering egg and larval development.3
In 2018, a case study was researched by Kansas State University, titled “Soil Surface Roughness and Turbidity Measurements in Erosion Testing.” This study had shown that turbidity measurements can also provide a secondary measurement of erosion and can help us determine the volume of soil eroded. So, turbidity measurement is a useful field tool in erosion control to help us determine the effectiveness of our BMPs.4
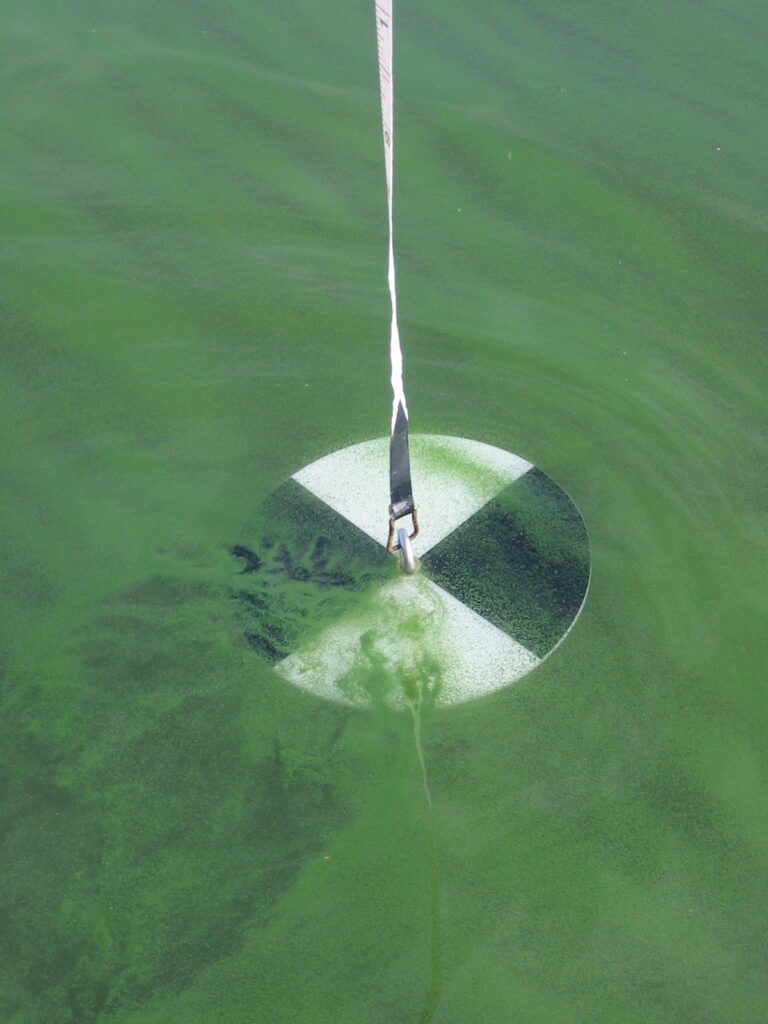
Turbidity can be measured in one of two ways: visually or instrumental. In the past, the Secchi disk (Figure 2), which does not require battery power or calibration, was used to monitor clarity or turbidity. A Secchi disk can be built using easy-to-find materials.5 A Secchi disk is one of several visual methods. This black and white round disk is lowered into the water until it cannot be seen any longer for the first measurement. Then it is raised until seen again for the final measurement. The average of these two measurements is the calculated clarity. The equation to calculate measurements: Secchi depth = (M1 + M2) ÷ 2. The disadvantages of a Secchi disk are that it will not work in a flowing current and is a much slower method to use than nephelometers.
Collecting Samples
Safety first always applies to collecting field water sampling. Your safety plan should always include safety boots, skin protection from the sun and insects. You should always be “situationally aware” of dangers in and around water, which include swift or deep waters, dangerous or poisonous animals, and today, even transient humans. In dangerous water conditions use a sampling pole or water sampler supplied with a Niskin bottle, or Van Dorn sampler.
Collection of samples should always be in this order:
- Prior to start of project if possible.
- Background or upstream sample taken after start of project to serve as baseline.
- At point or points of discharge from site.
- Downstream of the construction activities.
The depth to collect samples should be at the middle column and not on the top or bottom of the waterbody. In deep or swift water use a sampling pole with a Niskin bottle or Van Dorn sampler. Put the sample in a clean glassware bottle with no apparent scratches or smudges on the surface. Keep your fingers off the glassware, clean off the surface smudges using a Kimwipe and not your shirt tail. This will ensure that no light scattering will occur due to any foreign residue on the outside of the vile which could increase the turbidity reading. Insert the sample into the nephelometer following the manufacturer’s instructions for operation and within seconds, your results will be displayed in NTUs. Take the resulting NTU value and subtract it from the background sample NTU value to get the net NTU value for turbidity at the discharge point. Finally, document the net values on field data sheets.
Hopefully, this value will be below the threshold of the Surface Water Standard for turbidity. This regulatory value will vary from state to state as well as from country to country.
In conclusion, turbidity should always be used as an erosion field tool showing whether your BMPs and treatment systems are performing effectively as well as to maintain compliance with your permit.
References
- USGS, by Water Science School, How Much Water is There on Earth? November 13, 2019. https://www.usgs.gov/special-topics/water-science-school/science/how-much-water-there-earth
- International Erosion Control Association. Design Standards Glossary. https://ieca-standards.knowledgeowl.com/help/glossary#t.
- United States Environmental Protection Agency. Turbidity – Parameter Factsheet. July 2021. https://www.epa.gov/awma/turbidity-parameter-factsheet.
- Soil Surface Roughness and Turbidity Measurements in Erosion Testing, DOI:10.1061/9780784481585.049, Conference: IFCEE: 2018, by Tri V. Tran, Stacey Tucker-Kulesza, and Michelle Bernhardt, June 2018. https://www.researchgate.net/publication/325609979_Soil_Surface_Roughness_and_Turbidity_measurements_in_Erosion_Testing.
- Cary Institute of Ecosystem Studies. Measuring lake health: Secchi disk hot-to. www.caryinstitute.org/news-insights/guide/measuring-lake-health-secchi-disk-how. Video: https://www.youtube.com/watch?v=lr66G09PuKg.
About the Expert
Hal Lunsford, MPA, is a 46-year veteran environmentalist and an active member in the U.S. Green Building Council and the International Erosion Control Association (IECA) Southeastern Chapter. He chairs the Erosion and Sediment Control Education Track Committee for IECA. He is the state representative for Florida in the Southeastern Chapter of IECA and an actively qualified Florida Stormwater Erosion and Sediment Control Inspector and a private-sector instructor for the State of Florida Department of Environmental Protection in their FSESCI Program. He holds a bachelor’s degree in earth and atmospheric sciences and a master’s in public administration from the University of West Florida.


