

By Thad Wasklewicz, Ph.D; Richard Guthrie, Ph.D; Paul Eickenberg, PE; Benjamin Kramka, PE
Post-wildfire secondary hazards (debris floods and flows) play a prominent role in sediment transport along hillslopes, channels and alluvial fans.1 Wildfires have increased2,3 in conjunction with more frequent, intense rainfall4 where the rainfall is a key factor in secondary hazards.5 While awareness of debris flow initiation has increased, a need persists to predict debris flow pathways, runout and inundation. This information is essential to understanding and managing the potential hazard to human life, infrastructure, and property. Landslide modeling6,7 was used to estimate sediment volume, runout, and probability of occurrence to examine a recent debris flow at Black Hollow Road near Rustic, Colorado, USA. The results highlight the potential for taking a more proactive approach to landslide hazard assessment and mitigation.
Study Site
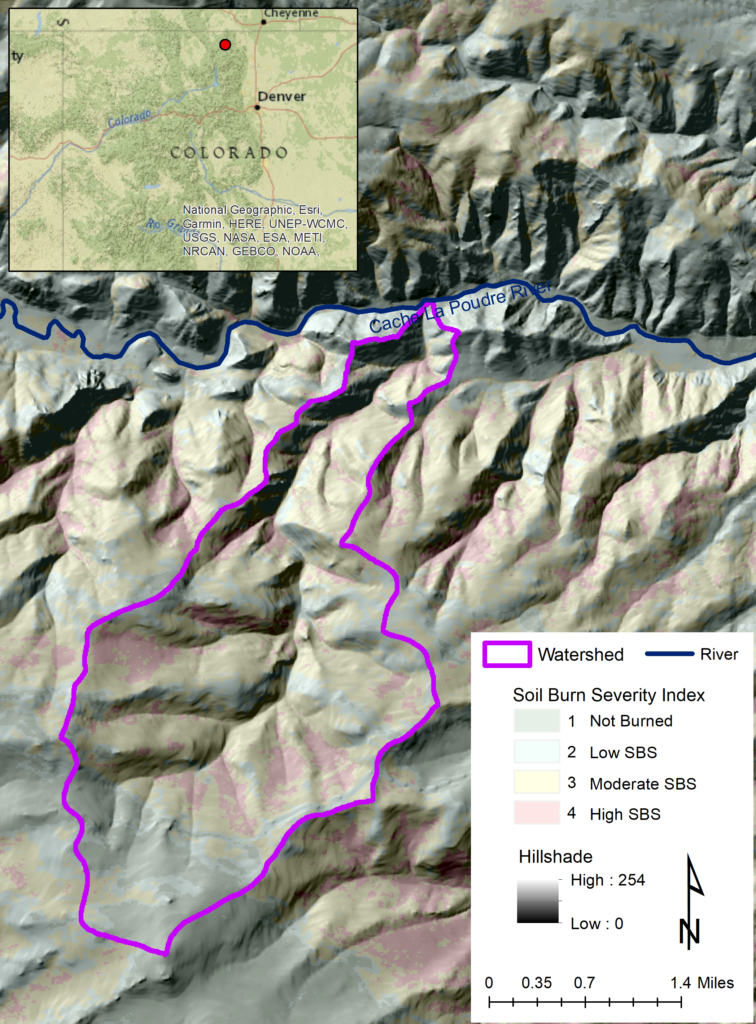
The Black Hollow drainage basin is 6.67 mi2 (17.28 km2) with a perennial stream and mean slope of 32% (Figure 1). The maximum basin elevation is 11,400 ft (3,475 m), and minimum basin elevation is 9,691 ft (2954 m). The basin receives mean annual precipitation of 20.15 in (51.18 cm). Stored colluvium and alluvium, >3.37 ft (>1 m) deep, are consistent throughout drainage.
The area was burned in the 2020 Cameron Peak Fire, which consumed 208,913 acres (84,544 hectares). The fire reduced or eliminated canopy and ground cover and altered the soil structure.8
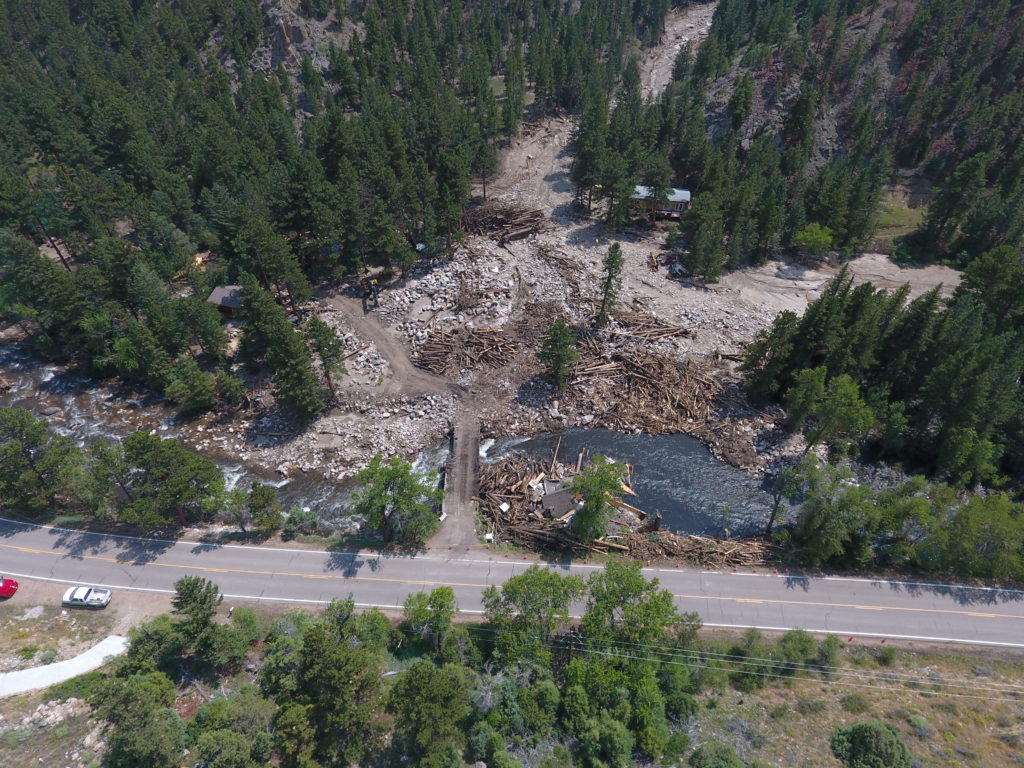
Hydrophobicity was highly inconsistent across the Cameron Peak Fire and was estimated to be 55% across half the burned area.8 The Black Hollow debris flow occurred on 20 July 2021, taking four lives, and destroying five homes, after an intense rainstorm occurred within the burned watershed (Figure 2). The peak 15 minute rainfall intensity was 37 mm/hr (0.36 inches in 15 min) as recorded from the nearby Washout Gulch rain gage.9 This equates to an approximate 1-year recurrence interval rainstorm according to NOAA Atlas 14.
Methods
A 10 m digital elevation model (DEM), which was the best available resolution for this area, was downloaded and imported into the modeling software. A user-defined initiation zone (30 m x 30 m) was established for the current project based on Burned Area Emergency Response (BAER) soil burn severity (SBS) map, slope and evidence of past debris flows (Figure 1). Initiation points were established in steep, first-order channels where high to moderate SBS were dominant.10,11,12
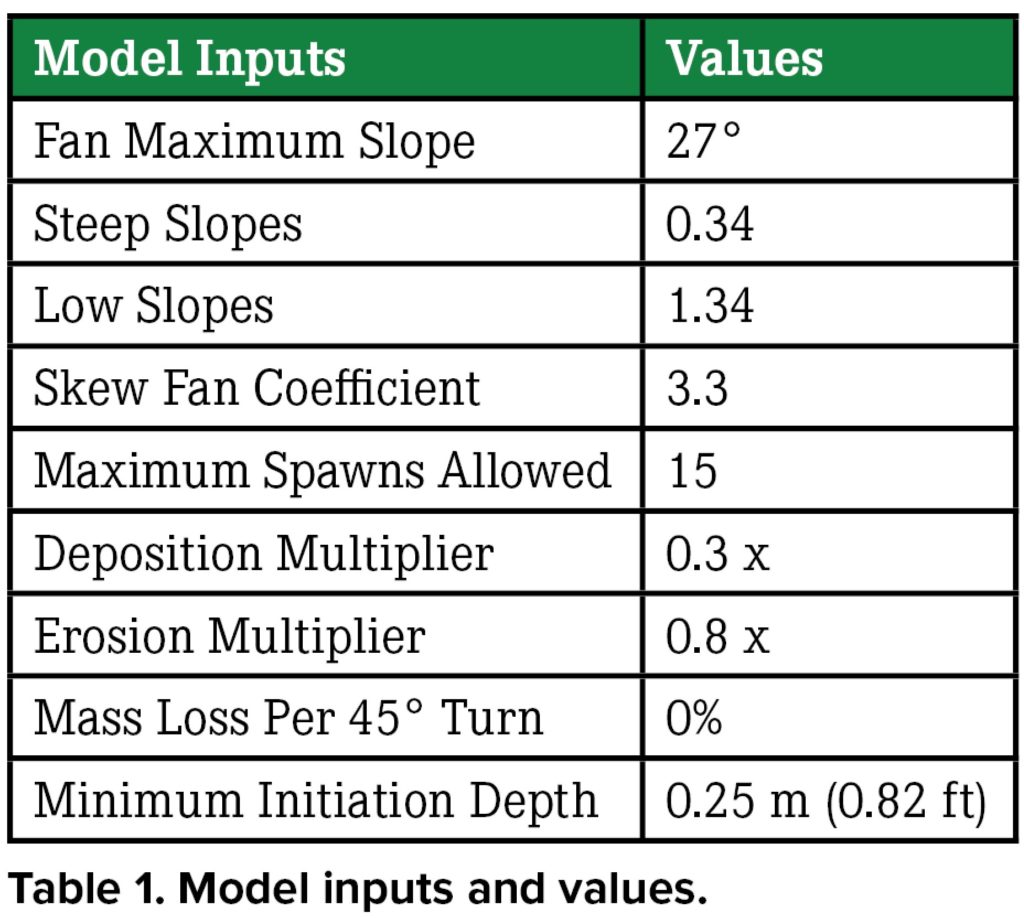
Our model consisted of parameters defined by simulations based on our observations from multiple sources of information and our past experiences (Table 1).
The debris flow data were produced from two separate simulations. First, 500 debris flow iterations were run to produce an average measure of depth, erosion, maximum depth and likelihood of occurrence per pixel occupied by the debris flows. Second, estimates of debris flow volumes, necessary for mitigation options, were measured using the same set of initiation points in 15 separate individual models runs.
Findings
Simulated debris flow runout traveled across the channel to the north bank of the Poudre River (Figures 2 and 3). Lower debris flow depths on the eastern side of the alluvial fan were consistent with field evidence (Figures 2 and 3). The debris flows also avulsed to the western side of the alluvial fan, a noted aspect of the debris flow at the site and a common occurrence in alluvial fans13 (Figures 2 and 3).
A maximum average depth of 2.7 ft (0.82 m in) from the 500 debris flow simulations was consistent with what was evident on the mid-fan and fan apex (Figure 3). The maximum depth evidenced from the 500 individual debris flows simulations averaged 3.6 ft (1.1 m), which would be consistent with depths found in the vicinity of the mid-fan to the toe of the alluvial fan. The average estimated volume of material brought to the fan was 44,372.5 yd3 (33,925.2 m3) but ranged from 32,066.5 yd3 (24,515.6 m3) to 57,659.5 yd3 (44,083.8 m3).
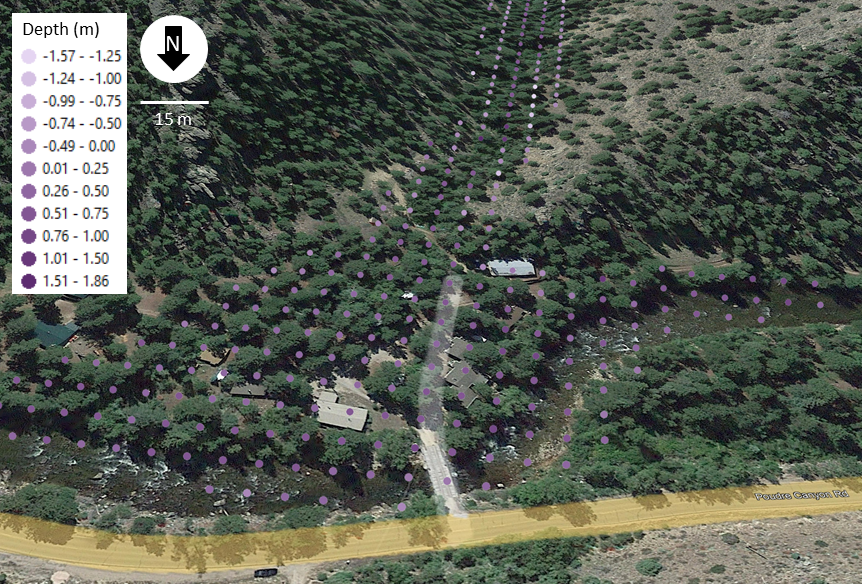
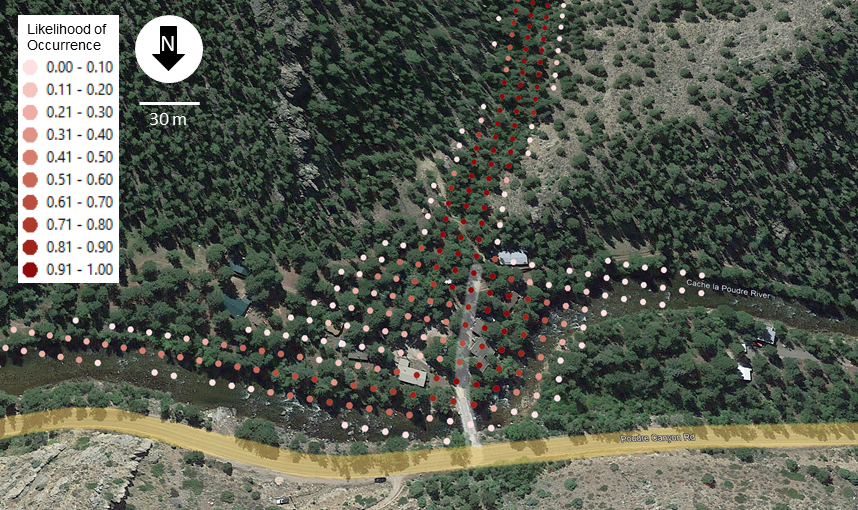
The likelihood of occurrence for the homes destroyed in the debris flow at Black Hollow were all more than 80%, except in one location where the probability of occurrence was 56% (Figure 4). The lower occurrence likely reflects a difference in the DEM compared to the actual elevation at the time of the debris flow or could be a change in elevation during the debris flow that could not be accounted for in our simulation.
The average flow depths at each of the residences would predict approximately 30% to 70% expected loss to a single-story timber frame home based on the widely used damage curves for wood structures.14 The maximum debris flow depths (as opposed to the average depths) occurring at the homes in the individual runs would have resulted in 82% to 100% expected loss to a single-story timber frame home and 50% to 100% expected loss to a two-story timber frame home.
Taking a Proactive Approach to Landslide Geohazards
The model results from Black Hollow credibly produced debris flows like the event that occurred on July 20, 2021. This landslide modeling approach can, and is intended to, be run as a proactive tool (rather than proven as a forensic tool) with comparable results and, indeed, has predicted the size and nature of debris flows that may yet occur in adjacent watersheds. The ability to use modeling and expert opinion to advance evidence-based management goals and make more informed decisions is a critical step in reducing the risks associated with these and other geohazards. The following steps are necessary to reduce the threat to lives and infrastructure from similar events based on the results presented here and our expert experience:
Identify susceptible hazard areas. This is now done frequently in Colorado where wildfires and high intensity storms (rainfall) are well understood to increase the probability of debris flow hazards. Susceptibility can be documented based on burn intensity and the monitoring of landslide triggering storms over the period of concern.
Model debris flow runout hazard. This is possible with the model employed for the Black Hollow Road site. Other methods such as geomorphic mapping and dating of debris flow deposits on occupied fans can also be deployed.
Effectively communicate model assessment findings to create the recognition and understanding of the hazard by residents and land managers. Ideally this would include some analysis of probability of occurrence.
Commitment to mitigation, monitoring, early warning, rezoning or buyout, as befits the situation; a plan to reduce the threat to lives most of all. The empirical model, used in this study, allows the land manager to better understand mitigation options that are necessary if other options are not considered.
Debris flow runout, volumes, burial depths and inundation extents are critical as there has been rapid expansion of development into the wildland urban interface. While planning expertise may not have been historically available, methods are now available to proactively estimate the threat posed by post-wildfire secondary hazards and assist in making informed decisions. Unfortunately, for communities affected by the Cameron Peak fire, the debris flow potential remains high for the next two or more years at this site and other locales within the Cameron Peak Fire.
References
1) L. A. McGuire, J. W. Kean, D. M. Staley, F. K. Rengers and T. A. Wasklewicz, “Constraining the relative importance of raindrop- and flow-driven sediment transport mechanisms in postwildfire environments and implications for recovery time scales,” Journal of Geophysical Research – Earth Surfaces, vol. 121, no. 11, pp. 2211–2237, 2016.
2) L. Westerling, H. G. Hidalgo, D. R. Cayan and T. W. Swetnam, “Warming and earlier spring increase western US forest wildfire activity,” Science, vol. 313, no. 5789, pp. 940-943, 2006.
3) J. T. Abatzoglou, A. P. Williams and R. Barbero, “Global Emergence of Anthropogenic Climate Change in Fire Weather Indices,” Geophysical Research Letters, vol. 46, pp. 326–336, 2019.
4) G. Wang, D. Wang, K. E. Trenberth, A. Erfanian, M. Yu, M. G. Bosilovich and D. T. Parr, “The peak structure and future changes of the relationships between extreme precipitation and temperature,” Nature Climate Change, vol. 7, no. 4, pp. 268–274, 2017.
5) J. W. Kean and D. M. Staley, “Forecasting the Frequency and Magnitude of Postfire Debris Flows Across Southern California,” Earth’s Future, vol. 9, p. e2020EF001735, 2021.
6) R. H. Guthrie and A. Befus, “DebrisFlow Predictor: an agent-based runout program for shallow landslides,” Natural Hazards and Earth System Sciences, vol. 21, pp. 1029–1049, 2021.
7) L. Crescenzo, G. Pecoraro, M. Calvello and R. H. Guthrie, “A probablistic model for assessing debris flow propagation at regional scale: a case study in Campania region, Italy.,” in EGU General Assembly 2021: NH3.2 – Debris flows: Advances on mechanics, controlling factors, monitoring, modeling, and risk management, Vienna, Austria, 2021.
8) BAER, “Cameron Peak Fire Forest Service Burned Area Emergency Response Executive Summary Arapaho Roosevelt National Forest December 15, 2020,” US Forest Service, 2020.
9) J. W. Kean, “Initial spot check of USGS debris flow likelihood and volume models for the Cameron Peak burn area and the 20 July 2021 flow event,” USGS, Golden, CO, USA, 2021.
10) D. M. Staley, G. M. Smoczyk and R. R. Reeves, “Emergency Assessment of Post-fire Debris-flow Hazards for the 2013 Powerhouse Fire, Southern California,” U.S. Geological Survey Open-File Report 2013–1248, 2013.
11) D. M. Staley, J. A. Negri, J. W. Kean, J. L. Laber, A. C. Tillery and A. M. Youberg, “Prediction of spatially explicit rainfall intensity–duration thresholds for post-fire debris-flow generation in the western United States,” Geomorphology, vol. 278, pp. 149–162, 2017.
12) D. M. Staley, J. A. Negri, J. W. Kean, J. L. Laber, A. C. Tillery and A. M. Youberg, “Updated Logistic Regression Equations for the Calculation of Post-Fire Debris-Flow Likelihood in the Western.,” U.S. Geological Survey Open-File Report 2016-1106, 2016.
13) T. de Haas, A. L. Densmore, M. Stoffel, H. Suwa, F. Imaizumi, J. A. Ballesteros-Canovas and T. A. Wasklewicz, “Avulsions and the spatio-temporal evolution of debris-flow fans,” Earth-Science Reviews, vol. 177, pp. 53–75, 2018.
14) R. L. Ciurean, H. Y. Hussin, H. Y. van Westen, M. Jaboyedoff, P. Nicolet, L. Chen, S. Frigerio and T. Glade, “Multi-scale debris flow vulnerability assessment and direct loss estimation of buildings in the Eastern Italian Alps,” Natural Hazards, vol. 85, pp. 929–957, 2017.
About the Experts
Thad Wasklewicz, Ph.D., is a principal at Stantec Consulting Services leading the USA Geohazards program. His expertise centers on steep stream geomorphology, hillslope and bluff erosion, and alluvial fan dynamics.
Richard H. Guthrie, Ph.D., is vice president, director of Geohazards at Stantec Consulting Services. His expertise is in geohazards and risk assessment. His team solves slope, river and erosion problems related to engineering, construction and the natural environment.
Paul Eickenberg, PE, is an associate at Stantec Consulting Services. His work includes slope stability and hazard mitigation design. He has experience with dam inspections and repairs as well as flood wall design and installation.
Benjamin Kramka, PE, is a geological/geotechnical engineer at Stantec Consulting Services. His recent work has focused on geological engineering projects related to mineral resource development and mining projects, reclamation and water infrastructure development.


