

By Gleicy Cavalcante, M.S., EIT; Gary L. Hawkins, Ph.D.; Ernest “Bill” Tollner, Ph.D., PE; Jon Calabria, Ph.D.
The increase of urban areas and climate change has made stormwater management and its role in the preservation of water quality and flood-risk events in the U.S. an evolving issue.
Research studies have shown that bioretention basins are efficient practices in reducing the amount of stormwater runoff that has to be handled in cities with combined sewer overflows (CSO). In cases where stormwater is directly channeled to local streams, bioretention basins can help improve water quality downstream by capturing excessive sediment and nutrient loadings as close to the source as possible.
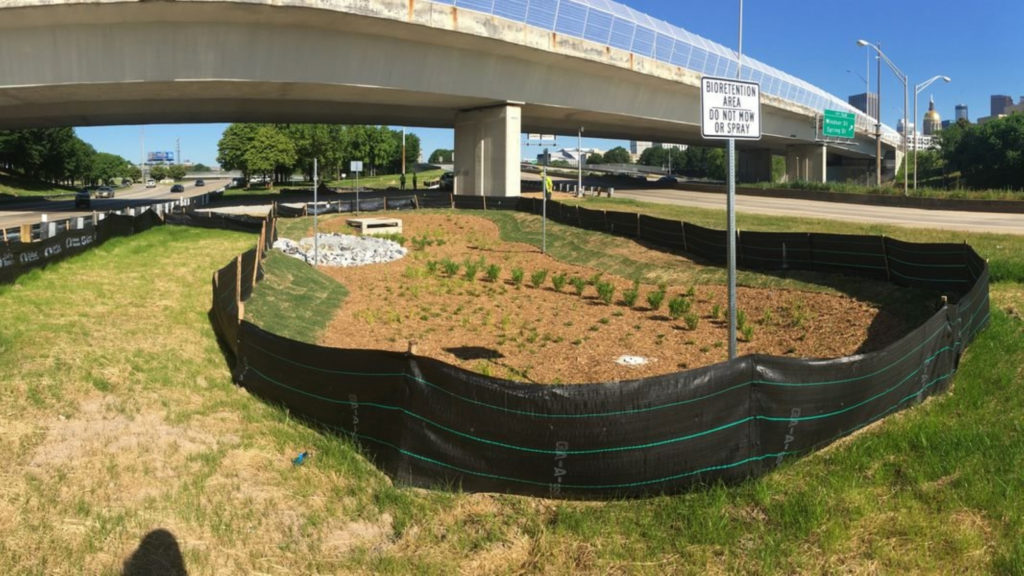
At the University of Georgia, researchers have been working with a bioretention system located in Atlanta, Georgia to monitor the performance of the basin in reducing pollutant loadings entering the Atlanta’s CSO system. The configuration of the inlet and outlet structure posed some questions on the potential of short-circuiting, or the bypassing of treatment mechanisms, occurring in the bioretention. When the runoff is unevenly distributed or short-circuited directly to the outlet structure, the detention time is reduced, and the system fails to provide adequate treatment. Therefore, hydraulic performance is considered the most critical factor in a bioretention’s efficiency.
To answer these questions, a 1:10 scale model was constructed and tested without bioretention media using tracer experiments. A fluorescent dye was used as a tracer and simulations of different flow conditions and tracer concentrations were performed at several flow rates. The Atlanta bioretention basin was designed and constructed with an underdrain pipe system and a side entrance which was dictated by the topography of the site (Figure 1).
Materials and Methods
Field measurements of the bioretention basin were taken and a 1:10 ratio model was built to study flow patterns under four varying scenarios. Atlanta runoff hydrographs were simulated in HydroCAD 10.10.4a, a storm event software, and then used to compute the scaled runoff flow of the model corresponding to Atlanta design storms of 1-, 2-, 5- and 10-years.
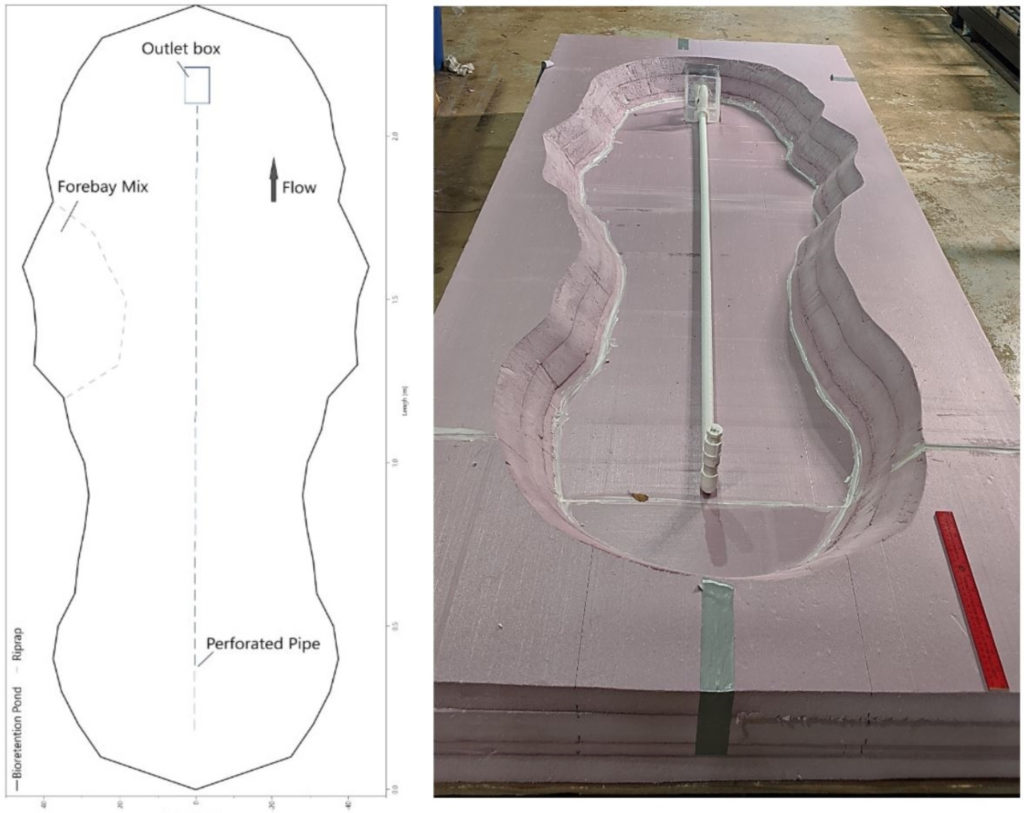
The model was constructed from foam board, PVC and plexiglass (Figure 2). The scaled forebay, outlet structure and underdrain were all placed in the model as placed in the basin. The model was 2.4 m long and had a volume of 116 L. The water depth in the model was 7 cm which corresponds to 10% of the media and water ponding depth.
Tracer studies were conducted by using a small centrifugal pump to supply 90% of the required flow as clean water and a peristaltic pump was used to supply tracer as the additional 10% of the required flow. The clean water and tracer dye were mixed at the point of entry into the forebay of the model. Prior to each run, the model was filled with clean water. Samples of outflow water was collected every 30 minutes for a run duration of 40 to 60 minutes. Collected samples were transferred to test tubes and visually compared to prepared standards ranging from 0–500 PPM of dye. These measurements were used to obtain residence times curves in the model. Photographs were taken for flow pattern analysis. To determine short-circuiting times, a short-circuiting index (SCI) was used to compare the time for passage of the 10th percentile of the tracer concentration in the inlet to that of the time necessary to fill the basin. For each designed storm simulated, the experiments were repeated at least three times.
Results
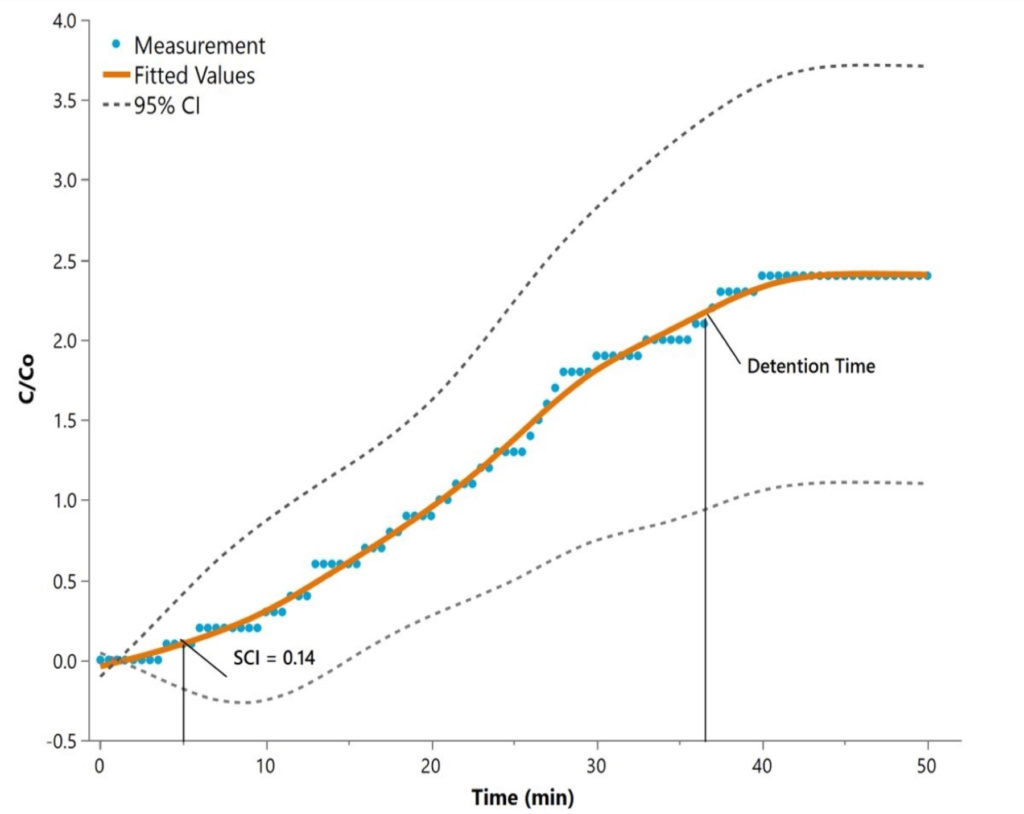
Twelve tracer experiments were performed in the lab for design storms with return periods of 1-, 2-, 5- and 10-years. The SCI values closer to one represent minor short-circuiting effects, whereas values closer to zero indicate high short-circuiting effects. In the first experiment, 1-year storm, the time for 10% of the initial tracer concentration to exit the outlet structure of the basin occurred at five minutes with an SCI-value of 0.14 (Figure 3). In the second experiment, a 2-year storm, the 10% initial concentration was measured at three minutes with an SCI-value of 0.09. In the third and fourth experiment, 5-, 10-year storms, the value remained three minutes but with SCI-values of 0.11 and 0.13, respectively.
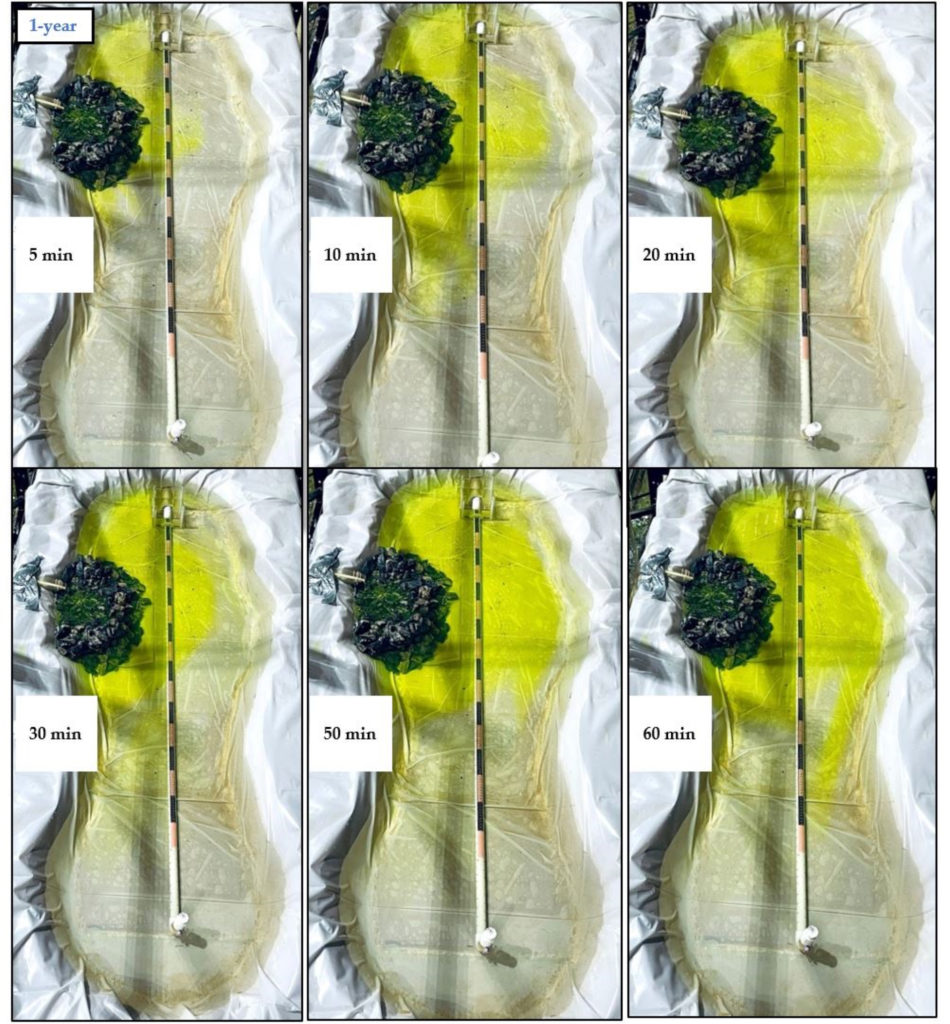
Figure 4 shows an aerial view of the flow distribution from tracer experiment one. It is known that, in field experiments, flow distribution can be influenced by numerous conditions such as unsteady flow rates, wind and temperature. However, the tracer experiments in this study disregarded those parameters due to controlled lab conditions.
The bioretention basin configuration showed a generally poor hydraulic performance, once all experiments had a low SCI-value, which represented high short-circuiting effects. In most cases, the effective volume of the basin for a 40-minute simulation was less than 50%. The amount of effective volume was highly influenced by the location of the inlet and outlet. Significant mixing effects were noticed near the inlet and outlet location, which were affected by the length-to-width ratio of the basin and perforated underdrain pipe. The residence time for all simulated flow rates appeared to be similar. The dye tracer solution reached the outlet section after five minutes for the 1-year storm and after three minutes for the 2-, 5- and 10-year storm.
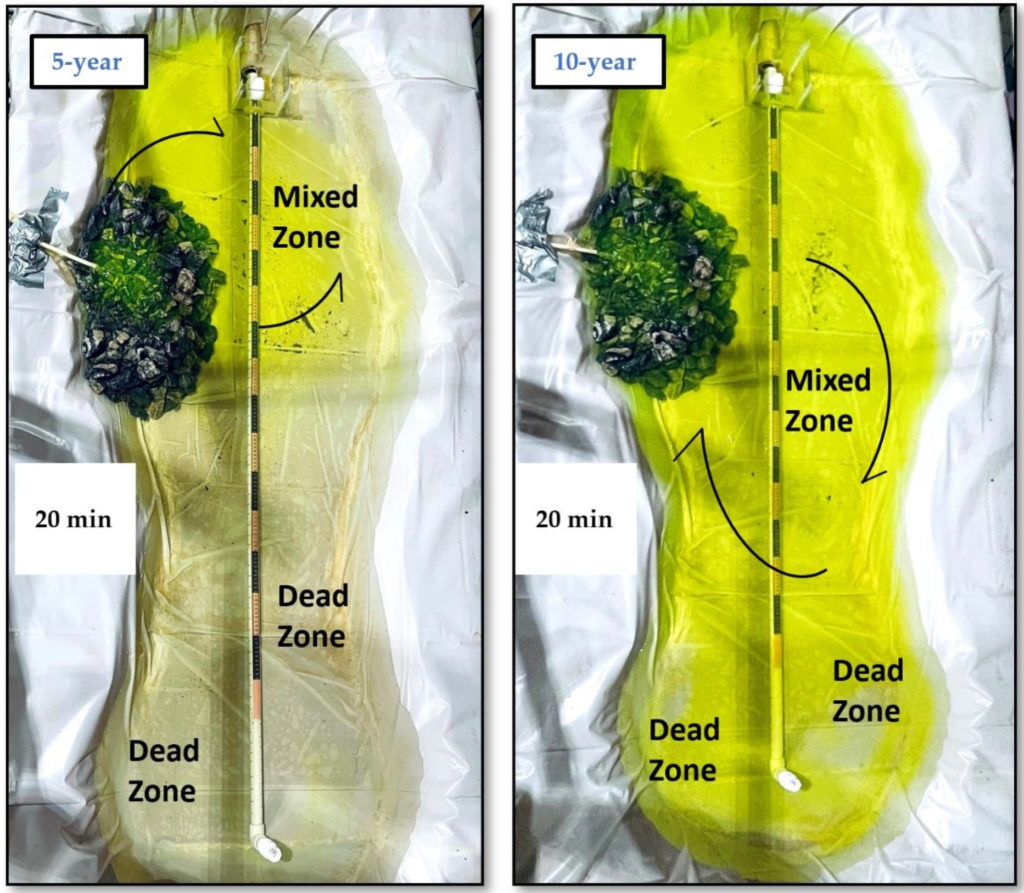
The presence of mixing and dead zones was noticed in all experiments. Figure 5 illustrates a schematic of the flow pattern for the 5- and 10-year storms. Mixing can be described as the random spread of tracer particles within the basin, usually caused by water flow and velocity profiles. Dead zones are not part of the volume through which water flows, which causes the effective pond treatment volume to be less than the total volume. This phenomenon can contribute to the reduction of residence time of most of the inflow, causing this way an increase of short-circuiting effects.
Conclusion
Regardless of how well a bioretention is designed, the location of the inlet and outlet dictates the overall hydraulic performance of the basin. The bioretention studied herein had the inlet structure designed and placed close to the outlet, based on the topography of the site. This location facilitated preferential flow paths and adjacent dead zones that caused some parcels of tracer water to exit significantly earlier than the detention time; therefore, high short-circuiting effects were observed.
In cases like this, structures, such as baffles and berms, are often used to direct water into the entire basin volume to promote a near equal soil media exposure to inflow. Future studies should investigate the effectiveness of these structures in reducing short-circuiting effects, and ultimately make recommendations on the most appropriate device for this bioretention geometry.
About the Experts
Cavalcante, M.S. is a water resources engineer with Woolpert in the Atlanta office. Gleicy has a background in environmental engineering and a M.S. in Civil Engineering from the University of Georgia.
Gary L. Hawkins, Ph.D., is an associate professor and water resource management extension specialist at the University of Georgia.
Ernest W. Tollner, Ph.D., PE is a native of Maysville, Kentucky and received his BS/MS and Ph.D degrees in agricultural engineering at the University of Kentucky and Auburn, respectively.
Jon Calabria, Ph.D., is an associate professor at the University of Georgia and a licensed landscape architect.


